Introduction
The crunchtabs package automates reporting for crunch datasets. It is designed to create toplines, cross tabulations and codebooks as tex (LaTeX), PDF or XLSX. The goal of this document is to provide you with enough information to go from nothing, to a client ready report, as fast as you can type. The examples included in this vignette use crunch’s built in pet dataset.
Installation
remotes::install_github("Crunch-io/rcrunch") # If not already installed
remotes::install_github("Crunch-io/crunchtabs")
Next, create a personal copy of the example data set for use with this vignette. This will ensure that you have the example dataset available to your account. A rudimentary understanding of the crunch R package is expected from readers of this document. Anyone with a crunch login should be able to follow along with the examples included here. If you are not familiar with crunch, the vignette is a good place to start getting started vignette.
library(crunchtabs)
login()
ds <- newExampledataset()
PDF Reports
crunchtabs generates PDF reports by writing generated LaTeX to a file, then compiling that file. A significant amount of thought has gone into the default settings and it is recommended that you stick with them. However, there is a bounty of structural and thematic options that can be adjusted or manipulated to your requirements (see the Theme Arguments section of ?themeNew for more information).
Create a Topline
# library(crunchtabs)
# login()

ds = loadDataset("Example dataset")
# Use ds = newExampleDataset() if not found!

toplines_summary <- crosstabs(dataset = ds)
writeLatex(toplines_summary, filename = "output", pdf = TRUE) # output.pdf will be written
NOTE: Although called
crosstabsthis function serves both purposes by creating summary data for toplines and cross tabulation reports. There is no function calledtoplines.
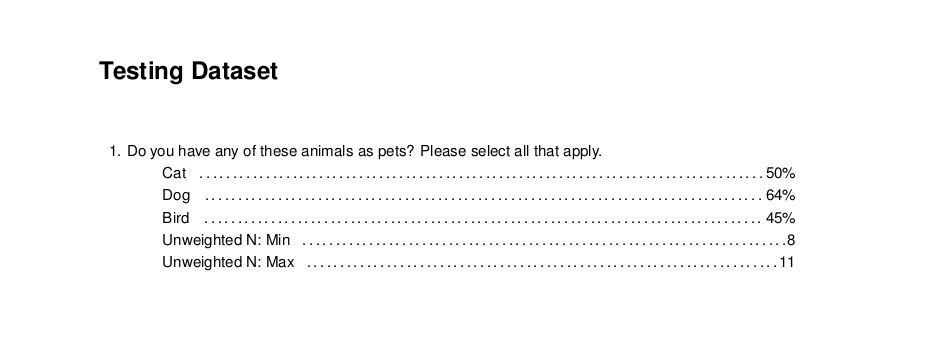
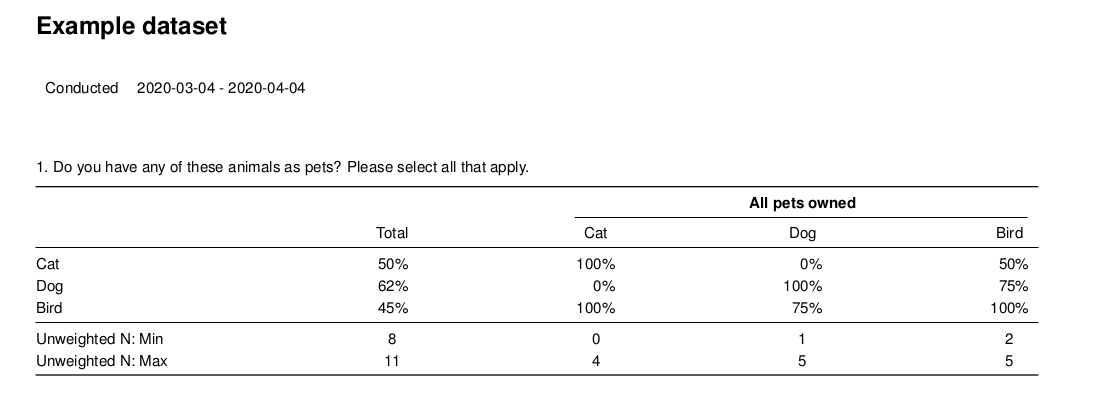
Topline Example from the Example Dataset
Create a Cross Tabulation
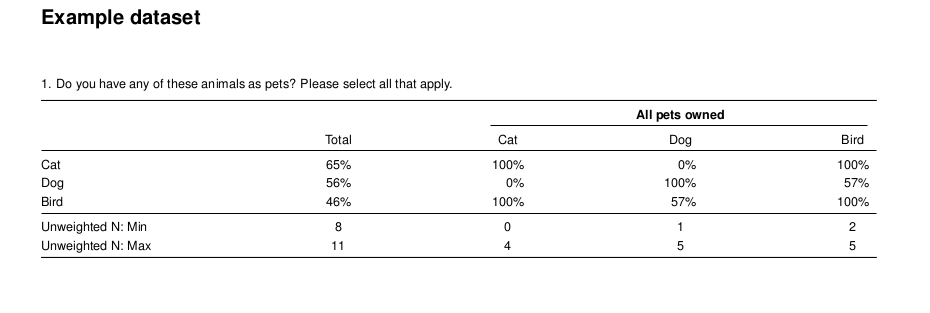
The only additional step required for a cross tab report is to create a banner object. Then, setting it as the banner argument for the crosstabs function. The code block below creates a cross tabulation report that shows the type of pet(s) respondents own, for every question in the survey. Once you have run the code, open the resulting output.pdf file. Inside of the report you will find a cross tabulation of all questions by pet ownership.
# library(crunchtabs)
# login()

ds = loadDataset("Example dataset")
# Use ds = newExampleDataset() if not found!

ct_banner <- banner(ds, vars = list(`banner 1` = c('allpets')))
ct_summary <- crosstabs(dataset = ds, banner = ct_banner) # banner parameter set here
writeLatex(ct_summary, filename = "output", pdf = TRUE) # output.pdf will be written 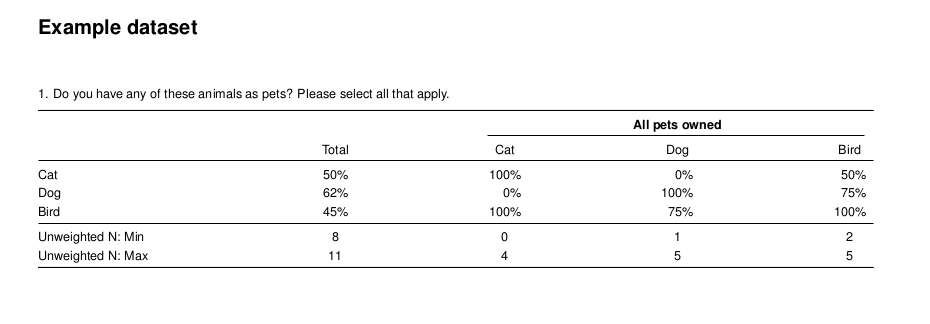
Cross Tabulation Example from the Example Dataset
Excel
To create documents in excel, the process is the same as that for creating PDF reports. However, in the last line of the example code block use writeExcel instead of writeLatex while also removing the pdf = TRUE argument. As with PDF reports, there are a large amount of options that can be set to adjust the look and feel of the resulting Excel spreadsheets (see the Theme Arguments section of ?themeNew for more information).
Unfortunately, toplines reports are not currently supported for Excel. However, this is a planned feature.
# ... cross tab
writeExcel(ct_summary, filename = "output") # output.xlsx will be written

# ... topline, not yet implemented
# writeExcel(toplines_summary, filename = "output") # output.xlsx will be written 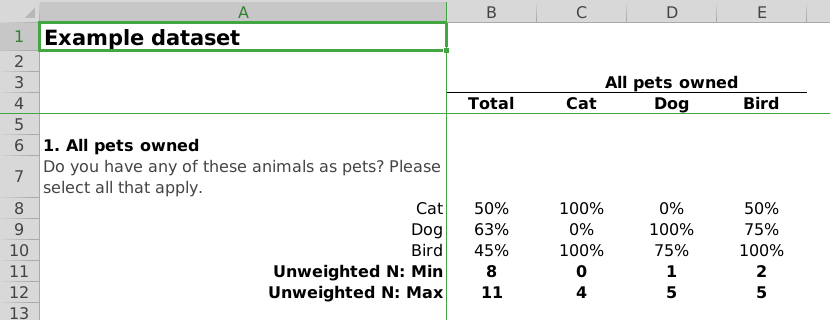
Cross Tabulation Excel Example from the Example Dataset
This package was designed to allow for some elements of style and structure to pass between the two formats. However, it should not be assumed that if something works in one format (Excel vs. PDF) it will work in another.
Structural Elements
The default result is immediately useful for a researcher. However, there are other elements that require additions or adjustments before sharing with a client or internal stakeholders, such as:
- Including or excluding questions
- Weighting our data
- Calculating and including the margin of error
- Adding titles
- Using a table of contents
- Customizing the theme
- Specifying a field window (PDF Only)
- Appending additional information (PDF Only)
While some of these may be firmly within the realm of “theme” items, the package separates concerns based on which functions within crunchtabs adjust them. For this reason structural elements are typically arguments to the writeLatex or writeExcel function directly. There are many more theme elements available in the themeNew function.
Including or Excluding Questions
By default, the crosstabs function attempts to create a topline or crosstab for all of the aliases that are visible to it in the dataset (names(dataset)). Creating a subset requires nothing more than a character vector with the aliases that you are interested in including in the report.
An alias is a name used to reference a question asked in a survey. For example,
q1references the question “What is your favorite pet?”. For more information see aliases in crunch
# library(crunchtabs)
# login()

ds = loadDataset("Example dataset")
# Use ds = newExampleDataset() if not found!

toplines_summary <- crosstabs(
  dataset = ds,
  vars = c("allpets", "q1", "petloc")
)

writeLatex(toplines_summary, filename = "output", pdf = TRUE) # output.pdf will be written
By setting the vars argument, you can limit the questions that are output by your call to writeLatex or writeExcel. Given that this argument is a character vector, it can also be useful to use exclusions if your dataset has a large number of questions:
# ...
toplines_summary <- crosstabs(
  dataset = ds,
  vars = setdiff(names(ds), c("country","petloc"))
)
# ...
A common usage pattern is to define the variables as their own R object and then assign that object to the parameter. Remember that if you change the vector of included question aliases you must also re-run the crosstabs function.
topline_vars <- c("allpets", "q1", "petloc")
topline_summary <- crosstabs(dataset = ds, vars = topline_vars)
writeLatex(toplines_summary, filename = "output") # output.pdf will be written
Recoding and Relabelling Banners
Sometimes the names presented in the banner of a crosstab are not desirable, too long, or lacking context. The crosstabs function has the built-in ability to recode the text labels. In the following example, the names of the pets are changed from Cat, Dog, or Bird, to their Spanish equivalents.
# library(crunchtabs)
# login()

ds = loadDataset("Example dataset")
# Use ds = newExampleDataset() if not found!

ct_banner <- banner(
  ds,
  vars = list(`banner 1` = 'allpets'),
  recodes = list("allpets" = list(Cat = 'Gato', Dog = 'Perro', Bird = 'Pájaro'))
)
ct_summary <- crosstabs(dataset = ds, banner = ct_banner) # banner parameter set here
writeLatex(ct_summary, filename = "output", pdf = TRUE) # output.pdf will be written 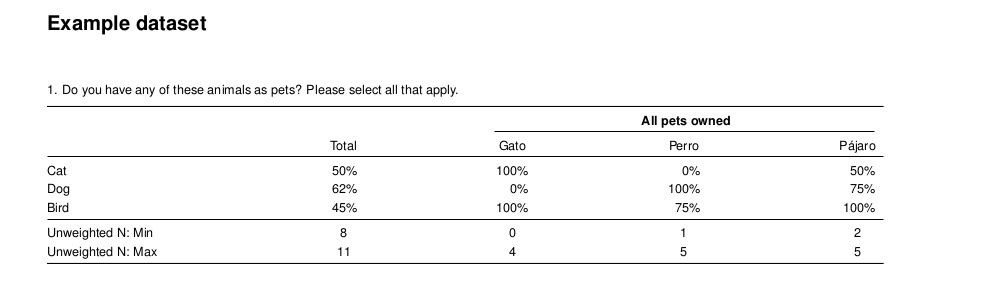
Cross Tabulation Recode
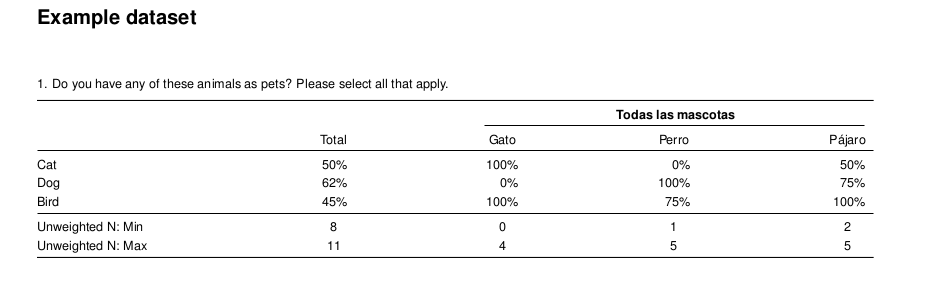
Notice that there is still “All pets owned”. To change the column headings, use the recode argument. To change the group header use the labels argument.
# library(crunchtabs)
# login()

ds = loadDataset("Example dataset")
# Use ds = newExampleDataset() if not found!

ct_banner <- banner(
  ds,
  vars = list(`banner 1` = 'allpets'),
  labels = c(allpets = "Todas las mascotas"), #
  recodes = list("allpets" = list(Cat = 'Gato', Dog = 'Perro', Bird = 'Pájaro')))
ct_summary <- crosstabs(dataset = ds, banner = ct_banner)
writeLatex(ct_summary, filename = "output", pdf = TRUE) # output.pdf will be written
Now, our header has been re-labeled as “Todas las mascotas”.
Cross Tabulation Relabel
Weighting Data
Most research work flows include a need to apply some kind of weighting scheme. Weighting is not applied automatically by default when running the crosstabs function. If your dataset has already been weighted earlier in your script, you do not need to specify a weighting variable. (you can check this with: weight(ds)). In the example below, the dataset does not have an existing weighting scheme so we must create one. Most datasets in the wild will already have one or more weighting variables available. You can check the aliases of these weighting variables by using weightingVariables(ds).
These data will be weighted so that they are is 75% cat lovers, 15% dog lovers and 10% bird lovers, with the extremely plausible assumption that almost everyone is a cat lover at heart.
# library(crunchtabs)
# login()

ds = loadDataset("Example dataset")
# Use ds = newExampleDataset() if not found!

weightVariables(ds) # NULL, no weighting variables

ds$weight = makeWeight(ds$q1 ~ c(0.75, 0.15, 0.10), name = "weight")
modifyWeightVariables(ds, "weight") # Assign "weight" as the weighting variable

ct_banner <- banner(
  ds,
  vars = list(`banner 1` = 'allpets')
)

ct_summary <- crosstabs(
  dataset = ds,
  weight = 'weight', # Specify your weight variable explicitly
  banner = ct_banner
)
writeLatex(ct_summary, filename = "output", pdf = TRUE)
After running modifyWeight our dataset now has a weighting variable assigned. You can verify this with weightVariables(ds).
Cross Tabulation Relabel
NOTE: In Crunch, a “viewer” of a dataset does not have access to the individuals rows and cannot weight data or calculate margin of error using the R crunch package.
Calculating and Displaying Margin of Error
Communicating the margin of error for your dataset is a typical requirement faced by all researchers. In the example below, margin of error is calculated using the weighting variable in the previous section (Weighting Data). There are a variety of ways for calculating margin of error depending on your survey. A very simple abstraction using your weight variable and the weighted base is provided as an example, below.
If you are inheriting a project from someone you will likely see some variation of the function below included in the scripts they currently use to create a crosstab.
# Margin of Error function
moe <- function(weightvar) {
weights = as.vector(weightvar)
n = sum(weights, na.rm = TRUE)
m <- qt(0.975, n - 1) *
sqrt(
(1 + (
sd(weights, na.rm = TRUE) /
mean(weights, na.rm = TRUE)
)^2)
) *
sqrt(1/(4 * n))
return(m)
}
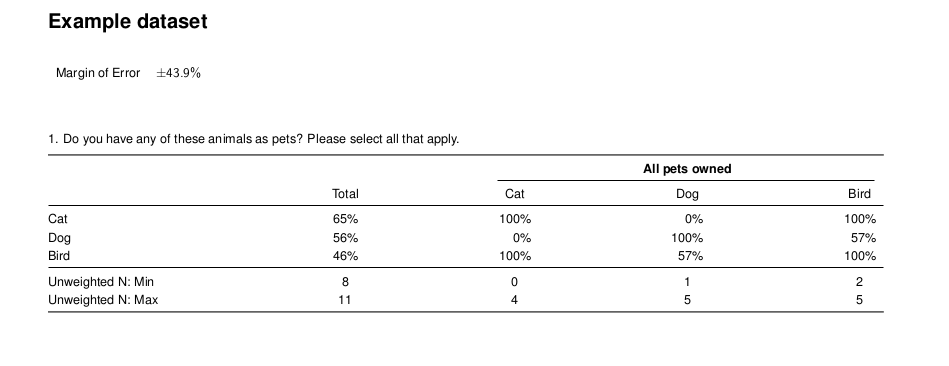
include_moe = moe(ds$weight)
writeLatex(
ct_summary,
filename = "output",
pdf = TRUE,
moe = include_moe
) In the example above the margin of error has been placed near the top of the page just below the title. A margin of error of 43.9% is not a desirable outcome for a survey. Thankfully, this is just an example.
Cross Tabulation Relabel
Adding Titles
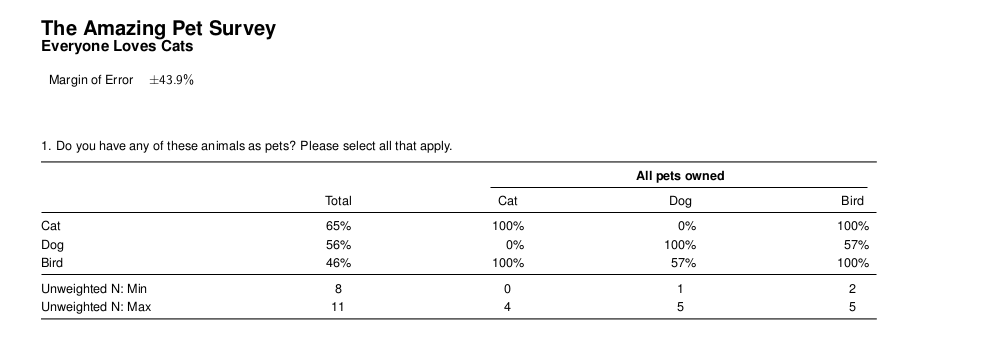
The default title behavior assigns the dataset name as the title on each page of the report. Often the internal reference used to denote a data set is not well aligned or appropriate for other stakeholders. You can customize this output by providing a title and a subtitle as in the example below.
writeLatex(
  ct_summary,
  filename = "output",
  title = "The Amazing Pet Survey",
  subtitle = "Everyone Loves Cats",
  pdf = TRUE,
  moe = include_moe
) 
Including Margin of Error
Including a Table of Contents
A small change to our call to writeLatex or writeExcel allows for the inclusion of a table of contents. In both document types this creates a “linked” table of contents that allows for navigation to the table of interest when the table of contents item is clicked.
writeLatex(
  ct_summary,
  # ...,
  table_of_contents = TRUE,
  pdf = TRUE
)

writeExcel(
  ct_summary,
  # ...,
  table_of_contents = TRUE
)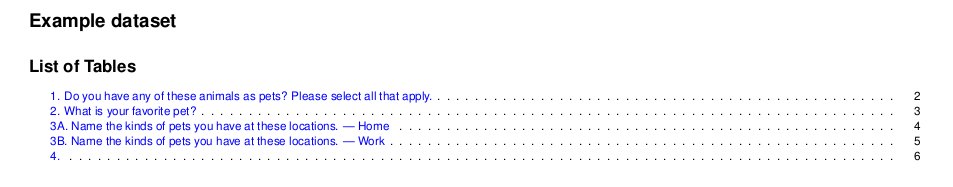
PDF: Table of Contents
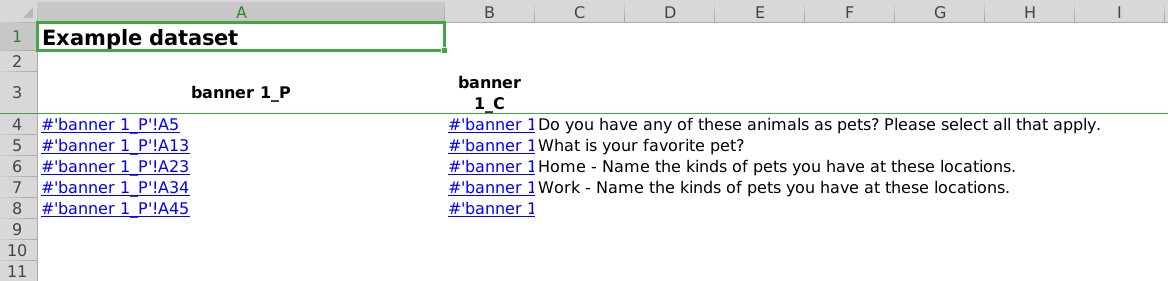
Excel: Table of Contents
Customizing Theme
There are a large amount of theme options available for both PDF and Excel reports. Below is a cursory example. It is recommended that you review ?themeNew for more specific details about all of the elements that can be changed.
myTheme = themeNew(
  ...
)

writeLatex(
  ct_summary,
  filename = "output",
  title = "The Amazing Pet Survey",
  subtitle = "Everyone Loves Cats",
  theme = myTheme,
  pdf = TRUE,
  moe = include_moe
)
Specifying a field window (PDF Only)
There are two common patterns for specifying a field window. The first is to specify it using the field_period argument of the writeLatex function. The second is to set your field window as the subtitle. In the Adding Titles section, the subtitle argument accepts arbitrary text.
writeLatex(
  # ...
  field_period = "2020-02-04 - 2020-03-04"
) 
Including a Field Period
Appending Text (PDF Only)
The string passed to append_text will be visible on the last page of your report.
writeLatex(
  # ...
  append_text = "Field Window: 2020-02-04 - 2020-03-04"
) 
Appending Basic Text
You can also append much larger chunks of text like a disclosure, analysis, or other marketing copy that is required for all of your documents. A typical workflow here is to create a .tex fragment file or an R string object that includes your copy. Tex makes significant use of the \ character. In R, you must escape the backslash with an additional backslash. In the example below you see \begin becomes \\begin and a new line \\ becomes \\\\.
myAppend = paste0(
"

\\begin{tabular*}{5.5in}{p{2in}p{4in}}
\\textbf{Sponsorship}   &    \\emph{CLIENTNAME} \\\\
\\addlinespace \\addlinespace
\\textbf{Fieldwork}    &    COMPANYNAME \\\\
\\addlinespace \\addlinespace
\\textbf{Interviewing Dates} &  2020-04-04 \\\\
\\addlinespace \\addlinespace
\\textbf{Target population}  &  US Adult Population \\\\
\\end{tabular*}

")
writeLatex(
  ct_summary,
  filename = "output",
  pdf = TRUE,
  append_text = myAppend
) 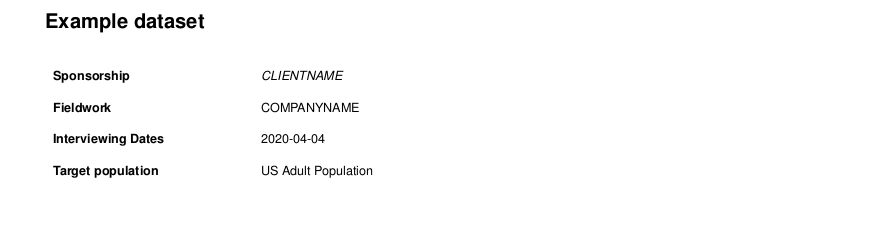
Appending Arbitrary Tex
Seeking Commentary
We are always seeking feedback on this and other documents or features of crunchtabs. Feel free to leave an issue
No pets were harmed in the making of this vignette.