Author: Brandon Bertelsen
Last updated: 2023-01-18
Reporting Over Time
crunchtabs supports two distinct forms of tracking reports. A tracking report where the same questions have been asked in the different datasets over time, and a recontact report where questions have been asked in the same survey requiring individual weighting. An example of this would be a political survey, where voters have been asked about their vote intention before and after a debate. The function to create tracking reports is much more flexible and is the recommended approach for creating reports of this nature where stacking datasets is of interest. It is not only limited to stacking data over time, it can also be used to stack datasets in different geographies from, for example, a global study, or any kind of split dataset.
Not all “recontact surveys” are formatted appropriately for use with the recontact_report function. It is often easier to get the desired result with trackingReport, by following these steps:
- Split your dataset by wave.
- Recalculate weights, ensuring the same variable name is used in all datasets.
- Align variable names so that they are the same in both datasets where they exist.
Missingness is dealt with gracefully. If there are missing data where a question was asked in one wave but not the other, the proportions are replaced with “-”.
Flipping Grids
Often the case may be that your category labels are long, and your wave descriptors are very short. In this case, crunchtabs provides options for “flipping grids”. You can transpose the presentation so that the wave labels are columns, and the category labels are rows.
To do so globally, we set the latex_flip_grids theme option to TRUE:
NOTE: If your dataset contains categorical_arrays that are present in only one wave, it is better to use latex_flip_specific_grids. An example is provided further below.
theme <- themeNew(..., latex_flip_grids = TRUE)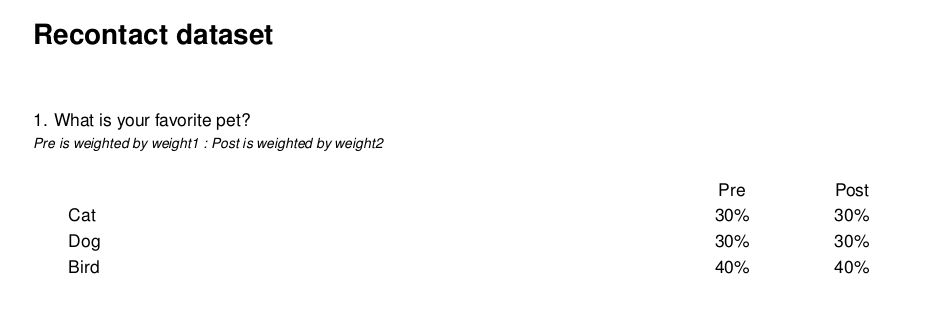
Recontact Example with flipped grid
In addition to global transposition of grids, you can also do so conditionally using the latex_flip_specific_grids theme option:
The above will only flip q1. When you have many variables and only a few that you do not want to be flipped, it can be useful to use setdiff() to opt out specific variables. This is especially desirable if your data include categorical arrays that were only asked in one wave, as these are often much wider than
Tracking Reports
While recontact reports are designed for questions asked in the same dataset, there is also the ability to present questions asked in multiple datasets in a similar fashion. Even if you have a single dataset it can often be useful to split, align the variable names and recalculate the weights to take advantage of trackingReport’s flexibility.
In the code block below, we illustrate data setup and an example call to trackingReports. While our example is not representative of a real-life situation, the manner in which you would need to manage data are the same.
# Create example datasets as waves 1,2 and 3.
ds1 <- newExampleDataset()
name(ds1) <- "Example dataset W1"

ds2 <- newExampleDataset()
name(ds2) <- "Example dataset W2"

ds3 <- newExampleDataset()
name(ds3) <- "Example dataset W3"

# Create weights
ds1$weight1 <- makeWeight(ds1$q1 ~ c(0.3,0.3,0.4,0), name = 'weight1')
ds2$weight1 <- makeWeight(ds2$q1 ~ c(0.4,0.4,0.1,0.1), name = 'weight1')
ds3$weight1 <- makeWeight(ds3$q1 ~ c(0.2,0.2,0.4,0.2), name = 'weight1')

# Ensure each dataset has a weight
weight(ds1) <- ds1$weight1
weight(ds2) <- ds2$weight1
weight(ds3) <- ds3$weight1

# Create a theme
theme <- themeNew(
  default_theme = themeDefaultLatex(),
  latex_flip_grids = TRUE
)

# Prepare the data object
ct <- trackingReport(
  dataset_list = list(ds1, ds2, ds3),
  vars = c("allpets", "q1", "petloc"),
  wave_labels = NULL # automatically Wave 1, 2, 3
)

# Write to latex and convert to pdf
writeLatex(ct, pdf = TRUE, theme = theme)
There are a number of important elements here:
The order of
dataset_listwill be the same as their presentation in the resulting PDF. There are no checks to verify their order. Order your dataset from oldest to youngest. Or, if your data are bound by some other element that is not time (like the same survey ran in different localities) consider listing the datasets in alphabetical order.The default
wave_labelswill be presented as Wave 1 through Wave N, where N is the length of thedataset_listIt is strongly recommended that you weight each dataset with the same variable. The
weightparameter accepts a character string that should reference a weighting variable in your datasets by its alias. Should you not specify a weight, the system will use the current weighting of each dataset (You can check what this is withweight(ds)). This can be useful if you have differently named weights across the datasets. But caution should be taken here as there is no way for the system to verify that your desired weight has been applied. As you saw in the example, it is recommended to assign your weight deliberately.Many defaults are extracted from the first dataset in the
dataset_list.
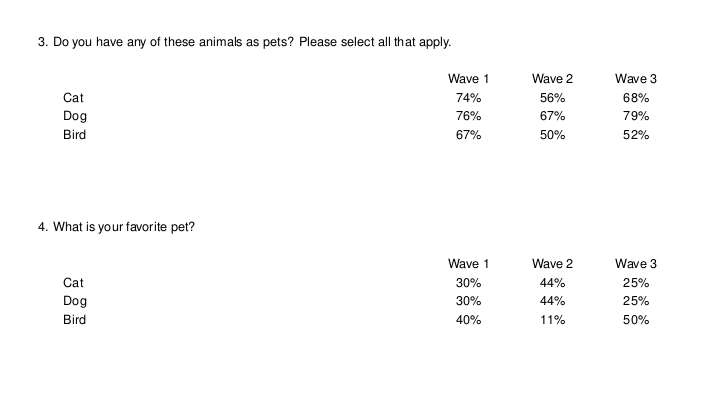
Example tracking report
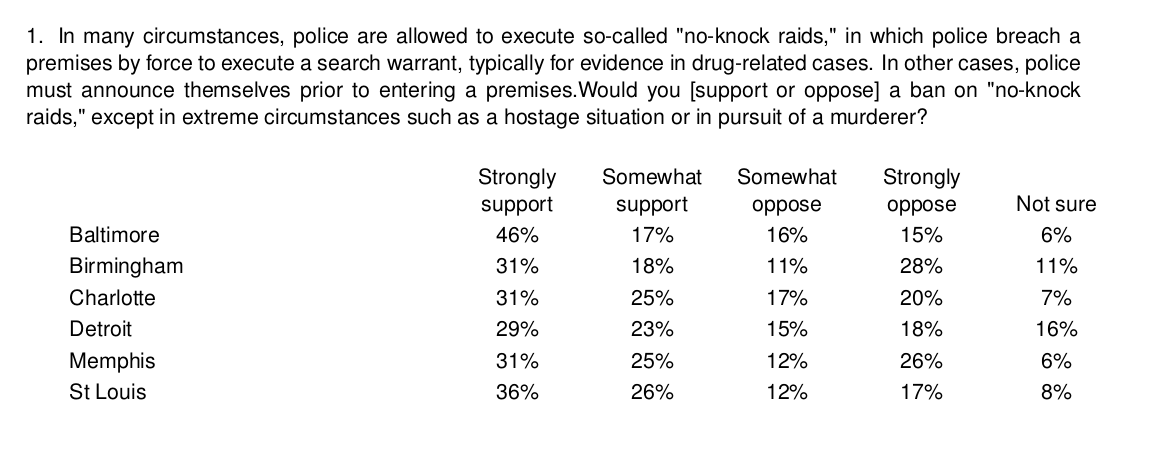
Tracking Reports for Other Stacking Data
Tracking reports accept any list of datasets. This means they can be used for a variety of situations where one needs to present a number of datasets in a stacked manner. Although called “tracking reports” they support any situation where the same questions are found in a list of datasets.
In the example below, a political survey question is shown that was asked in different cities across the United States of America regarding no-knock warrants.
Generic stacking data
Although you will not be able to recreate this code locally, below is a recommended approach for aggregating similarly named datasets:
library(crunchtabs)
login()

# Dataset names tend to have minor variation, in this case it was the place:
places <- sort(c("St Louis", "Memphis", "Detroit", "Charlotte", "Baltimore", "Birmingham"))
ds_names <- sprintf("Campaign Zero %s October 2020", places)
ds_list <- lapply(ds_names, loadDataset)

# Specify the variable(s). They must exist in all datasets
vars <- c("noknock_supop")

# Create the results object
ct <- trackingReport(
  ds_list, wave_label = places,
  vars = vars)

# Write to latex
writeLatex(ct, pdf = TRUE)
Relabeling Categories or Responses
There are a number of situations where your category names in a multiple response or categorical array question may be too long for reasonable presentation. Flipping grids is a good option, however, this may not be desirable or possible due to the number of waves or datasets that you are working with. For these cases, crunchtabs offers the ability to relabel your responses or to reposition them.
Relabeling
Renaming happens just before printing to latex, that means you can create customizations for other defaults using this command. It’s important to recognize that this will overwrite both labels and subvariable names. If you define it appropriately, it will rename it. This includes wave names, category labels or multiple response statements.
You can generally relabel any element of the specified alias. The question options (categories), items (statements in an array), the notes (typically the subtext of a question), or the description (question text).
Generating a Recontact Report
A recontact report is a special case and has limited flexibility.
- Variables must have a suffix identifying the pre and post waves.
- Two separate weighting variables
In the code below, the crunch example dataset is used to illustrate the setup required for recontact style reporting. There are a few important assumptions about the naming and setup of your data that are critical to the success of this function:
- Your “pre” and “post” wave’s questions should both have the same categories.
- Your “pre” and “post” wave’s question names should be equal, with different suffixes, such as: question_pre and question_post.
library(crunchtabs)
login()

# Create an example dataset
ds <- newExampleDataset()
ds <- loadDataset("Example dataset")

# Generate weights
ds$weight1 <- makeWeight(ds$q1 ~ c(0.3,0.3,0.4,0), name = 'weight1')
ds$weight2 <- makeWeight(ds$q1 ~ c(0.4,0.4,0.1,0.1), name = 'weight2')

# Oddity of crunch, you can't use a weight in a tabBook that
# has never been applied to the dataset.
weight(ds) <- ds$weight1
weight(ds) <- ds$weight2
weight(ds) <- ds$weight1

# Fake pre and post questions
ds$q1_pre <- copyVariable(ds$q1, deep = TRUE, name = "Pet name pre")
ds$q1_post <- copyVariable(ds$q1, deep = TRUE, name = "Pet name post")
ds$country_pre <- copyVariable(ds$country, deep = TRUE, name = "Country pre")
ds$country_post <- copyVariable(ds$country, deep = TRUE, name = "Country post")

ct <- recontact_toplines(
  ds,
  questions = c("q1", "country"),
  suffixes = c("_pre", "_post"),
  labels = c("Pre", "Post"),
  weights = c("weight1", "weight2")
)


theme <- themeNew(default_theme = themeDefaultLatex(), one_per_sheet = FALSE)
writeLatex(ct, pdf = TRUE, open = TRUE, theme = theme)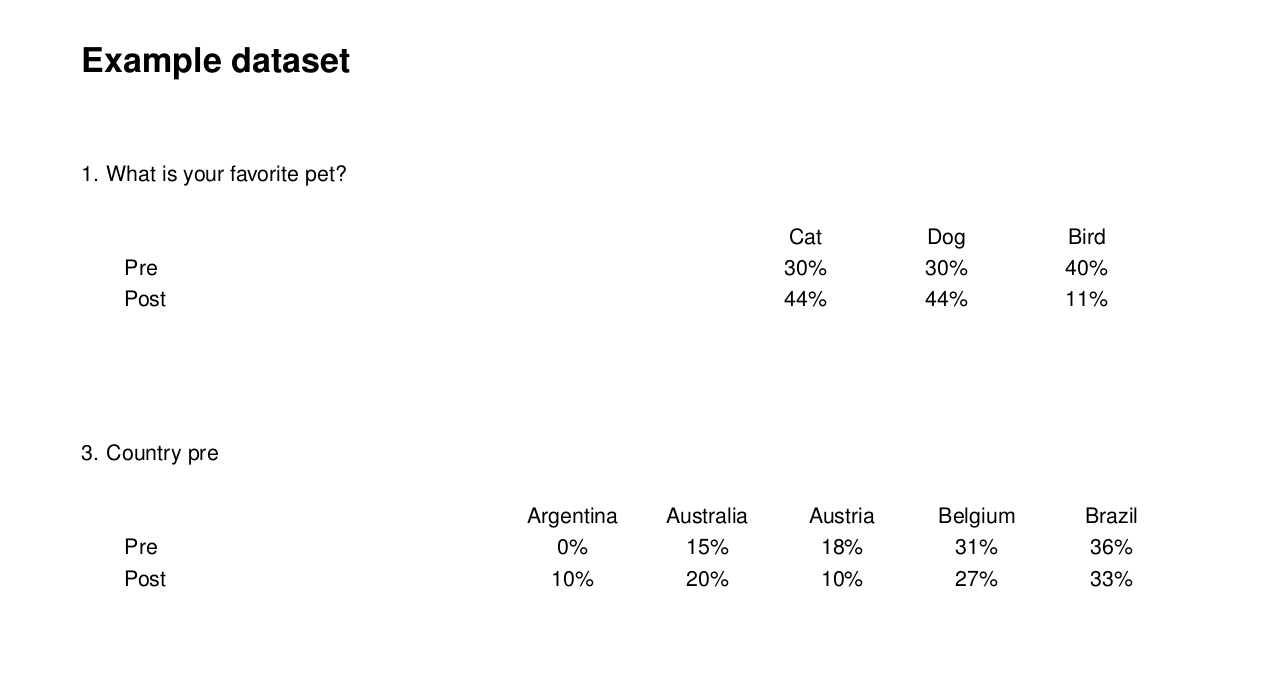
Recontact Example